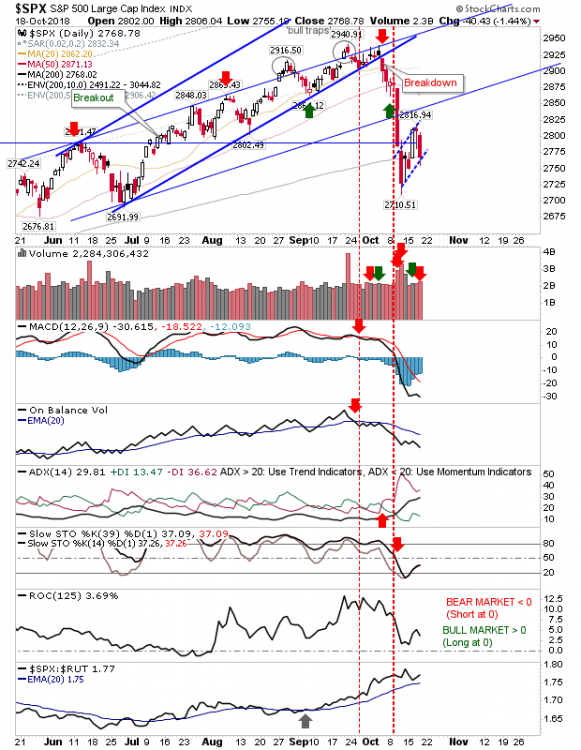
Since the last update indices got their bounce but the last couple of days have seen these gains gradually erased. Over the course of the week, the entire bounce has the look ‘bear flags’ as part of larger measured moves lower. Should this emerge then indices will be close to offering the long-term ‘buy’ signals I track in the tables below every blog post I make (available on markets.fallondpicks.com for syndicated content). Last of which for all three indices was February 2016
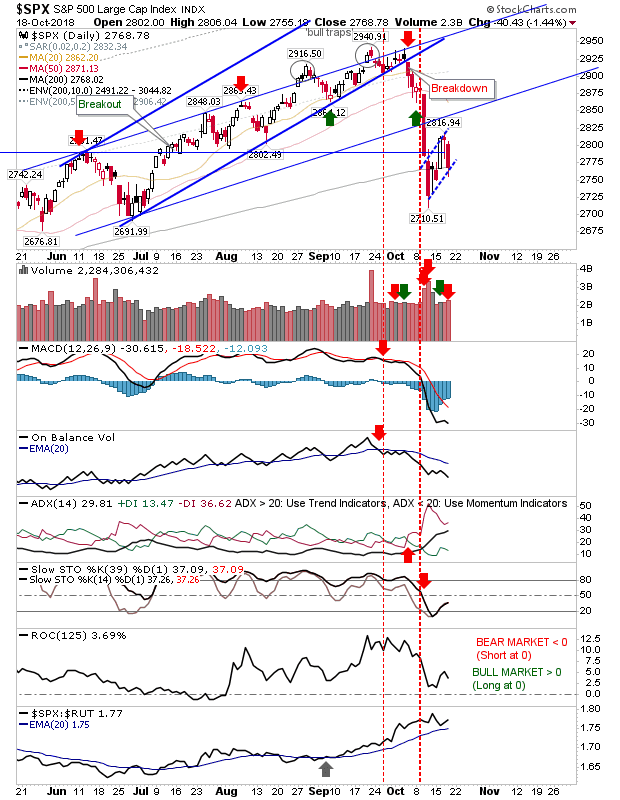
For the S&P, the measured move target is 2,585. This comes on a day of higher volume distribution with an acceleration of On-Balance-Volume lower and other technicals net bearish. However, relative performance is accelerating higher (vs Small Caps) and the index is clinging on to its 200-day MA
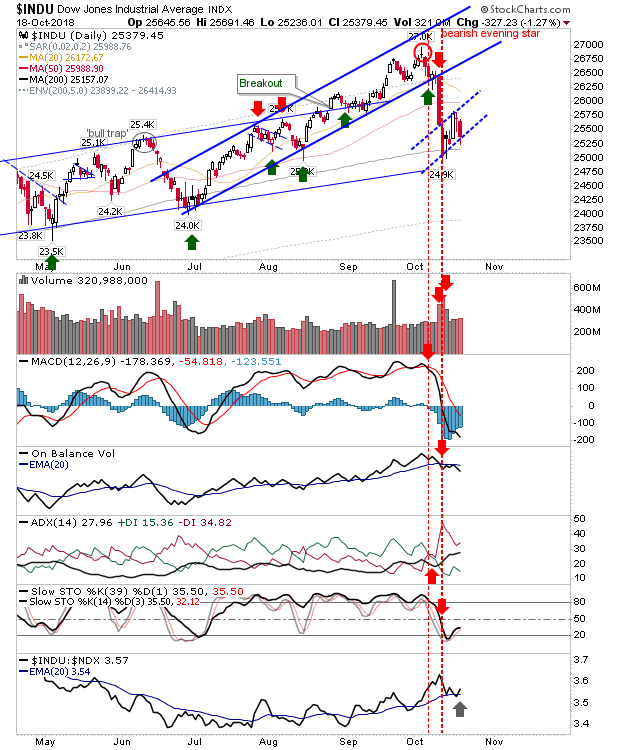
The Dow Jones Index ‘bear flag’ has emerged off a bounce in the 200-day MA. Bulls have the best chance to defend the moving average and relative performance is good too.
Tech indices also managed to regain their 200-day MAs and enjoy relative performance advantages in Small Caps.
For the Nasdaq 100, the measured move target is 6,400-6,500 zone which is close to the May swing low.
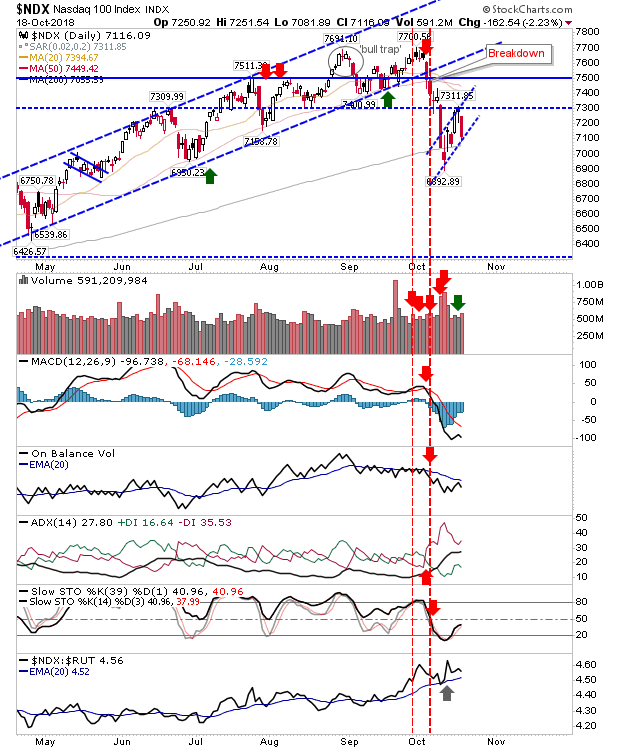
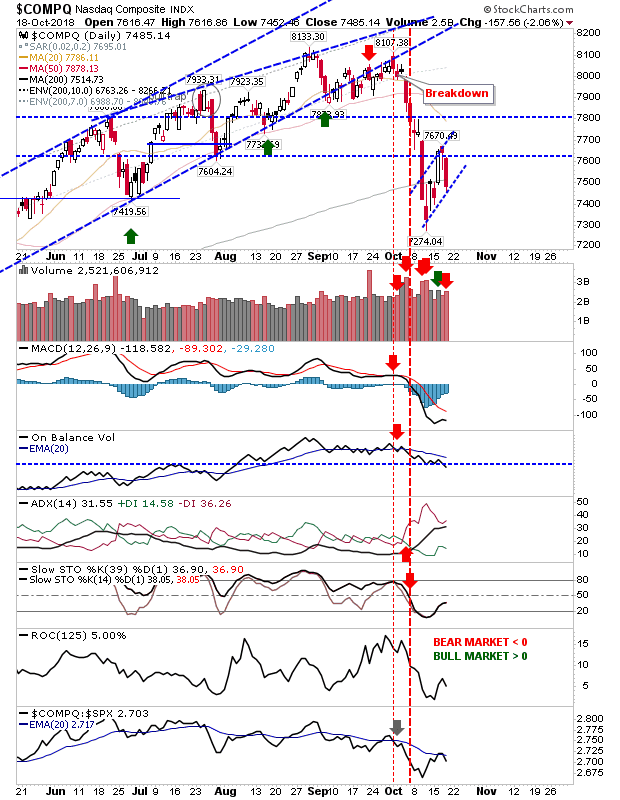
It was a slightly different story for the Nasdaq which is one of the indices struggling to keep its 200-day MA. The ‘bear flag’ target is 6,840 which is good for a 10% loss against 200-day MA and just shy of an investor ‘buy’ signal.
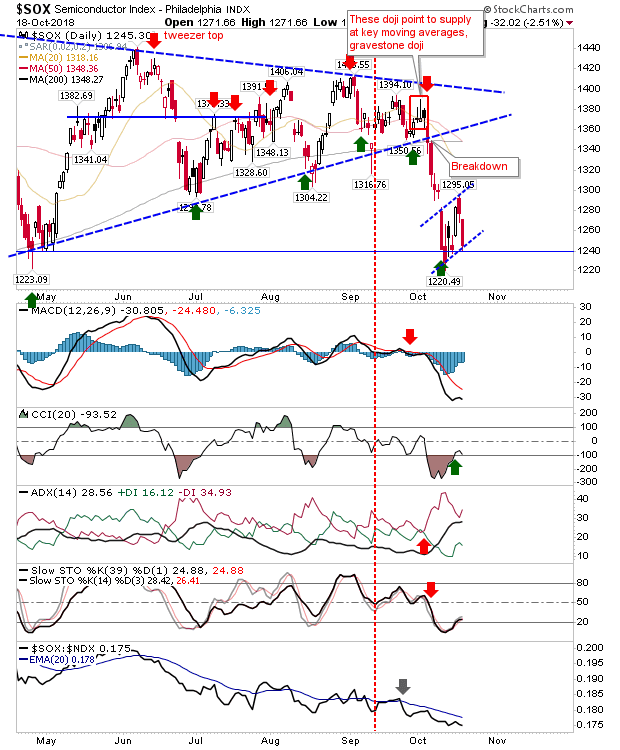
The Semiconductor Index is most damaged with all lead moving averages rolling over and the bounce off May lows (remember, the current projected target for the Nasdaq 100) is struggling. The measured move target is 1,125 which doesn’t really have a natural support level to lean on (early price congestion in 2017 at best) but 750s is the main congestion zone – a long (long) way away.
The ‘bear flag’ in the Russell 2000 has the most bearish momentum leading into it. Shorts will pounce if the ‘bear flag’ breaks, setting up a measured move to 1,390. Technicals are all horrible, even ROC has dropped below 0 after months of comfortable existence.


