
Fundamental Forecast for Gold: Mixed
GOLD PRICE RIDES ON EQUITY STABILITY
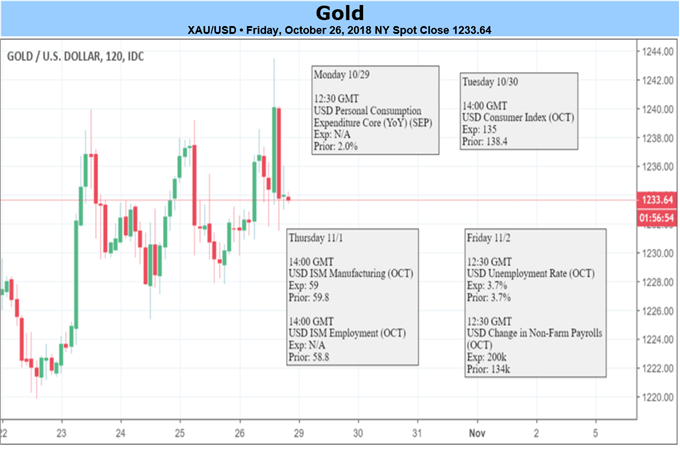
Gold staged another formidable rally this week as US equities remained under pressure. The precious metal has enjoyed the attention of investors looking to hedge their portfolio which has resulted in a climb of roughly $50 in October. On a percentage basis, the gain translates to slightly over 4. Friday’s bounce prompted gold to reach a three-month high above $1240.
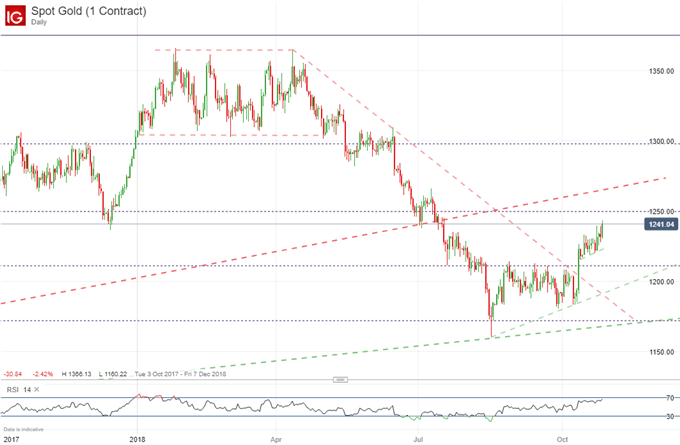
GOLD PRICE CHART DAILY, OCTOBER 2017 – OCTOBER 2018

With a continuous demand for gold in recent weeks, RSI has remained on the upper half of the range and nears overbought levels. Typically this is a bearish development but given the fundamental and technical landscape for equities, it could be argued a high RSI should be discounted somewhat. While it may be discounted, it should not be discarded and thus the high RSI should be a sign of caution for gold bulls.
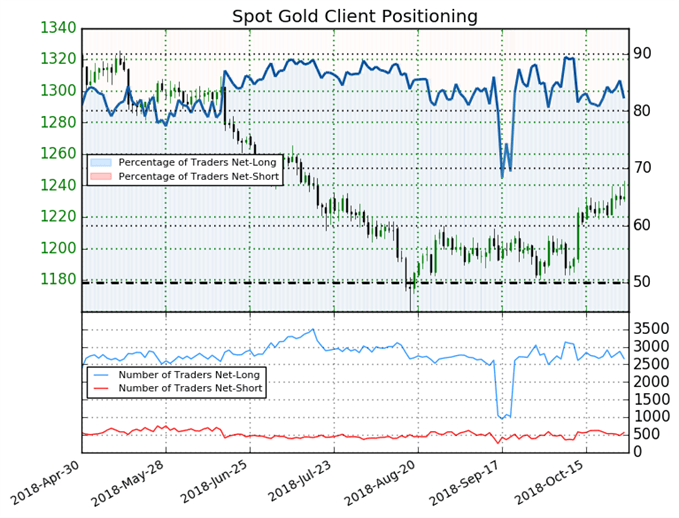
Similarly, IG’s client data reveals retail traders remain overwhelmingly net-long. Often used as a contrarian indicator, the large percentage of traders net-long provides another headwind for gold bulls and further complicates the outlook.

Retail trader data shows 82.2% of traders are net-long with the ratio of traders long to short at 4.63 to 1. The number of traders net-long is 6.8% lower than yesterday and 3.0% lower from last week, while the number of traders net-short is 5.1% higher than yesterday and 12.1% lower from last week.
Unlike the past two weeks, next week has a loaded economic calendar. The Bank of Japan and the Bank of England have their respective rate decisions while Canada, Mexico and the Eurozone are due to release Q3 GDP figures. The week also has a smorgasbord of other high and medium-importance events that will weigh on inflation, rate outlooks, equity performance and therefore gold’s performance.


