After a phenomenal 2017, the last eight months have been painful for emerging market (EM) investors. The initial leg lower coincided with a general spike in volatility in February. Since then, we’ve seen declines from January levels of almost 15% for a broad EM equity index, 20% for broad China benchmarks, 13% for EM local currency debt and close to 4% for EM hard currency debt. A large portion of this was driven by EM currencies, which were down more than 8% over this time period. However, despite this period of negative performance, we believe this year’s downdraft could lead to opportunity.
EM Assets: 1/31/18—9/30/18

For definitions of terms in the chart, please visit our glossary.
Taking Stock of EM
When assets are down by these magnitudes, it provides investors an important opportunity to evaluate the exposures in their portfolios and look for opportunities to refresh positions while booking tax losses that may offset realized gains elsewhere in the portfolio.
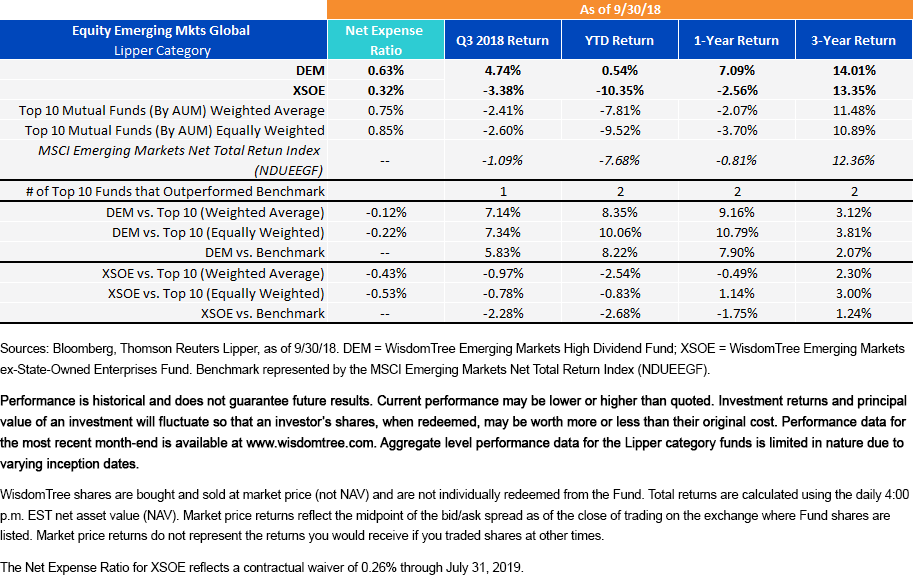
We examined the top 10 largest active and passive mutual funds/exchange-traded funds (ETFs) in EM equities, Chinese equities, EM local debt and EM hard currency debt and evaluated their performance during the downturn in order to highlight opportunities for tax loss harvesting.
Global EM Equities

For standardized performance of the Funds, please see their respective ticker: DEM, XSOE.
Opportunities in Emerging Market Equities: Whether one has been allocating to core and broad-based passive ETFs or using an active manager, this has been a tough year for EM equity positions. There are a few options to consider when swapping EM equities.


