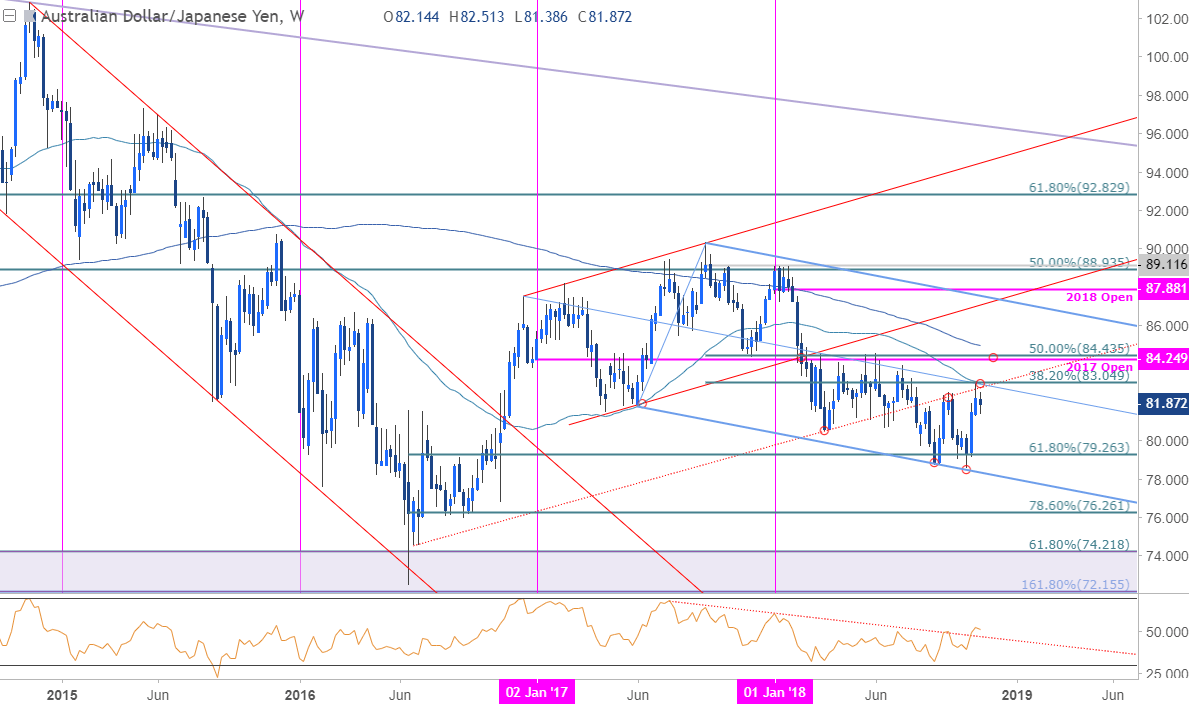
In this series, we scale-back and take a look at the broader technical picture to gain a bit more perspective on where we are in trend. The Australian Dollar has rallied more than 4.7% against the Japanese Yen since the yearly lows registered last month with price testing a critical resistance barrier around the 83-handle. Here are the key targets & invalidation levels that matter on the AUD/JPY weekly chart.
AUD/JPY WEEKLY PRICE CHART

Notes: AUD/JPY is trading just below a critical resistance confluence at 83.00/05 – this region is defined by the 38.2% retracement of the 2017 decline & the 52-week moving average converge and converges on the median-line of the pitchfork extending off the 2016 / 2017 highs (blue) and former trendline support (red). Note that a resistance trigger in weekly RSI has already broken and highlights a change in the momentum profile.
A topside breach/close above this threshold exposes the 50% retracement / 2017 open at 84.25/44 with the 200-week moving average just higher at ~85.00. Support remains at the 61.8% retracement / low-week close at 76.26/29 and is backed by pitchfork support. Weakness beyond this threshold would likely fuel accelerated losses towards 76.26 and beyond.
Bottom line: AUD/JPY has continued to trade within the August / September range and we’re looking for the break for guidance. Price is testing the upper bounds of this region and a breach/close above 83.00/05 is needed to keep the immediate long-bias viable. From a trading standpoint, the ideal scenario would see prices pullback for more favorable entries while above the March lows at 80.55. I’ll publish an updated AUD/JPY Scalp Report once we get further clarity on near-term price action. Keep in mind we have the release of Australia employment figures on tap later tonight.


