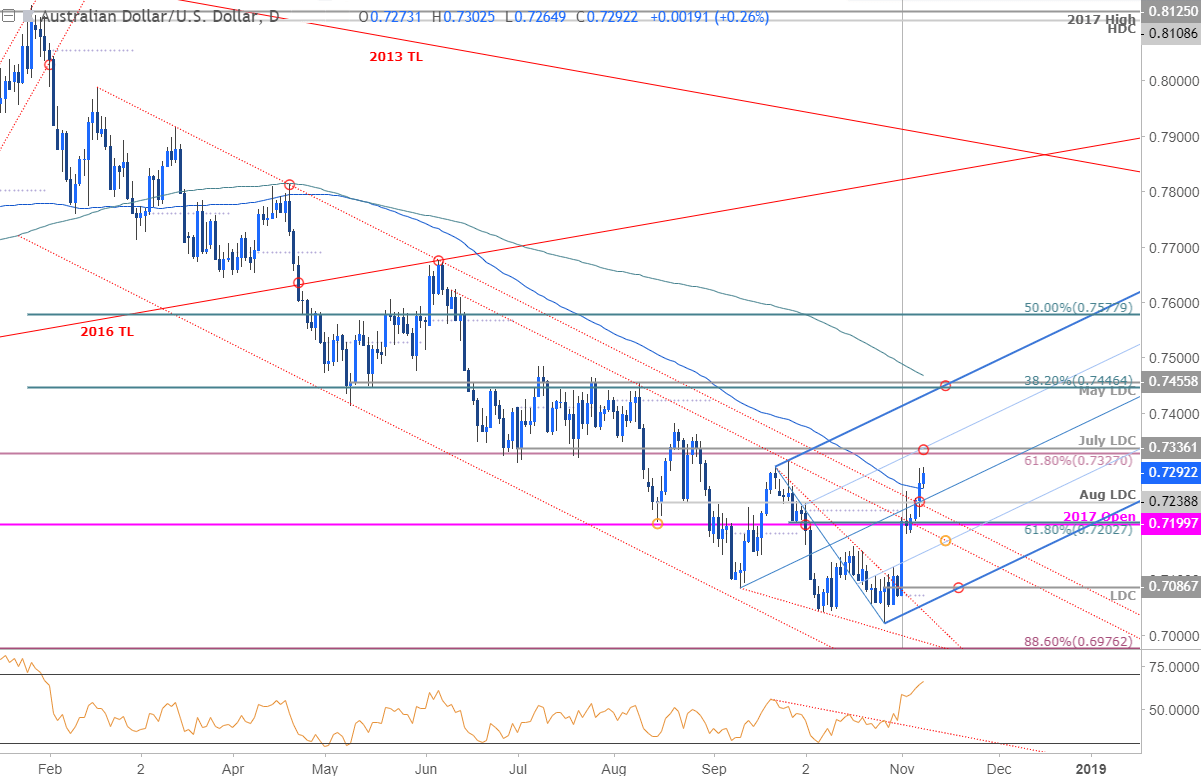
The Australian Dollar is up nearly 4% off the yearly lows with the rally breaking through yearly down-trend resistance this week. Here are the updated targets and invalidation levels that matter on the AUD/USD charts this week.
AUD/USD DAILY PRICE CHART

Technical Outlook: In my latest AUD/USD Weekly Technical Outlook we highlighted a multi-month resistance slope in price with our ‘bottom line’ favoring the long-side while above the low-day close at 7087. A breach above confluence resistance at 7239 yesterday has cleared the way for a larger advance with our focus higher in Aussie while above the trendline confluence around ~7160 (yellow).
Initial daily resistance stands at 7327/36 with a breach / close above the upper 50-line targeting a more significant zone at 7446/56 where the 38.2% retracement of the yearly range and the May low-day close converge on pitchfork resistance (note the 200-day moving average just higher).
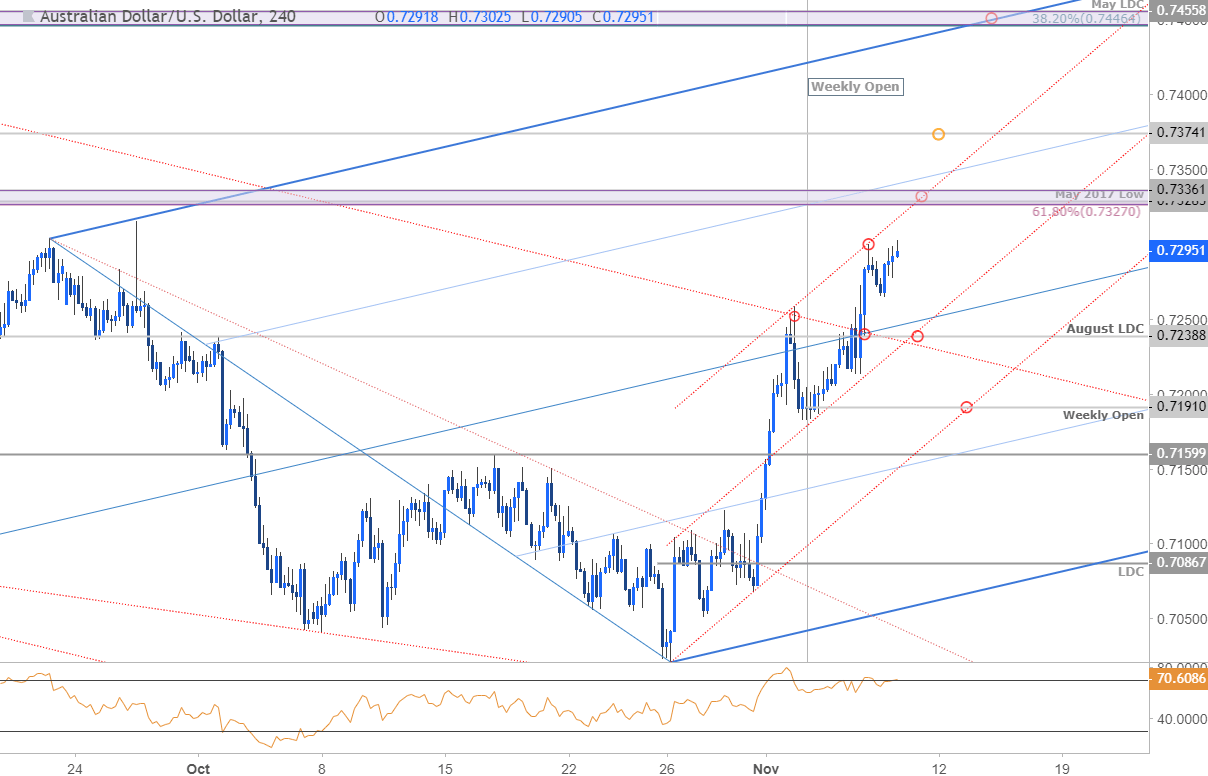
AUD/USD 240MIN PRICE CHART

Notes: A closer look at price action shows AUD/USD trading within the confines of a slope series originating off the late-October lows (red). Initial support rests at back at 7239 with our near-term focus higher while above the lower parallel / weekly open support at 7191. A break below 7160 would be needed to suggest a more significant high is in place. Look for a breach above 7336 to fuel the next leg targeting 7374 and key resistance at 7446/56.
Bottom line: AUD/USD has broken above multi-month slope resistance and although the broader outlook remains constructive, the advance may be vulnerable near-term while below 7327/36. From a trading standpoint, we’ll continue to favor fading weakness while above weekly open support targeting a breach of the October highs. A break lower would invalidate the reversal play with such a scenario exposing a drop back towards the yearly low-day close at 7086 (note monthly open comes in at 7072).


