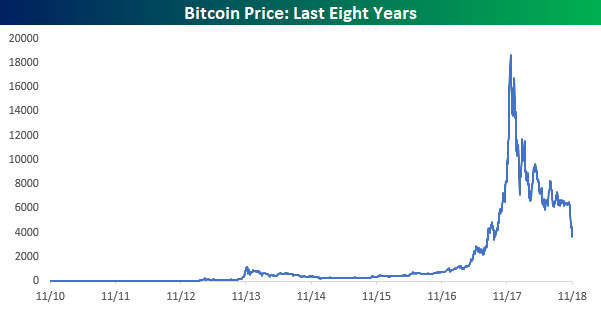
What a difference a year makes! Last year at this time, bitcoin was in the middle of a run where it seemed to break through 1,000-point thresholds every couple of days (and in some cases even faster). Now, the leading crypto-currency is seemingly crashing through 1,000 point thresholds to the downside on what seems like a daily basis. In under two weeks now, the price has dropped below 6,000, 5,000, and now 4,000 today.

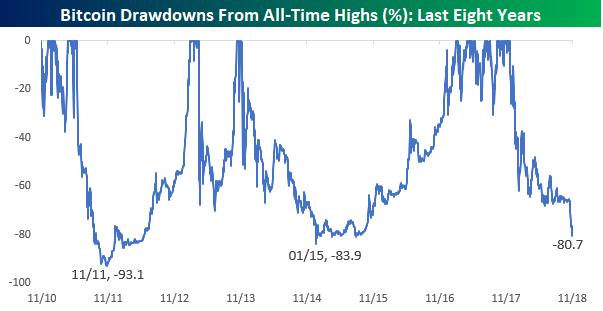
The chart above is certainly ugly, and while the decline from the peak earlier this year is by far the largest in point terms, in percentage terms as well, bitcoin’s decline from the highs is nearing historical proportions. In its eight-plus year history, the current decline is only the third time that bitcoin has declined more than 80% from an all-time high. The largest decline ended in November 2011 when the price fell 93.1% from its high. Then, in January 2015, bitcoin experienced a drawdown of 83.9% from its high. In order for the current decline to move into second place in terms of magnitude, bitcoin would have to fall below 3,006 (-17%) and to surpass the record decline from November 2011, the price would have to fall another 64% to 1,288 or lower.

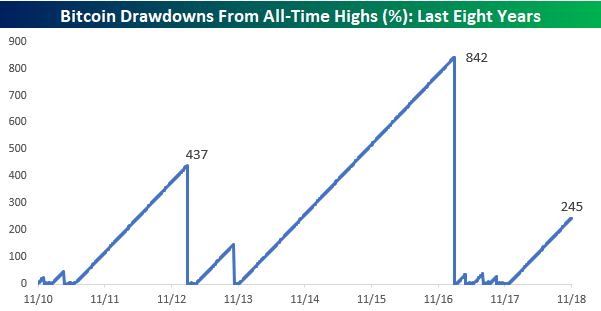
Similar to its current percentage decline, bitcoin’s drought without closing at an all-time high is also the third longest on record. At 245 calendar days and counting, the current drawdown is still 597 days shorter than the gap between highs from 2013 through early 2017, and 192 days shorter than the gap from 2011 through early 2013. In terms of getting to the down 80% point, though, at 245 days, the current drop is now second behind the 2011 period which took just 62 days.


