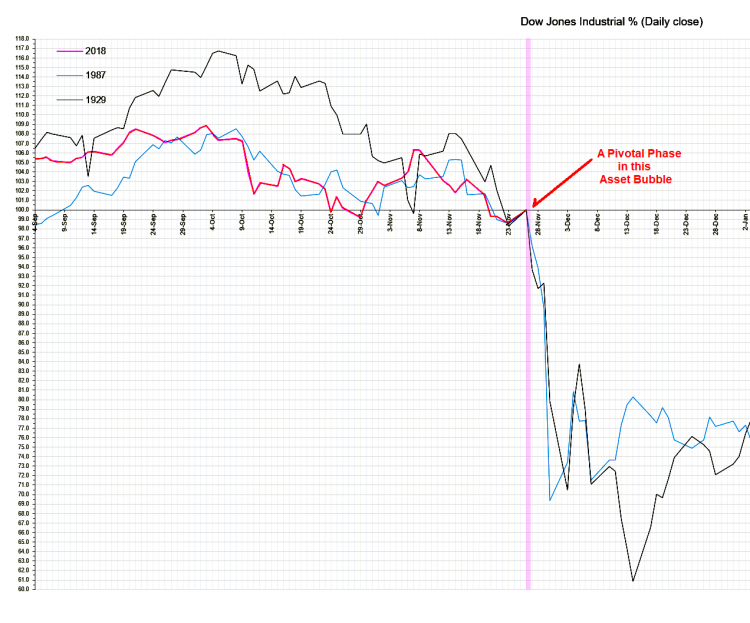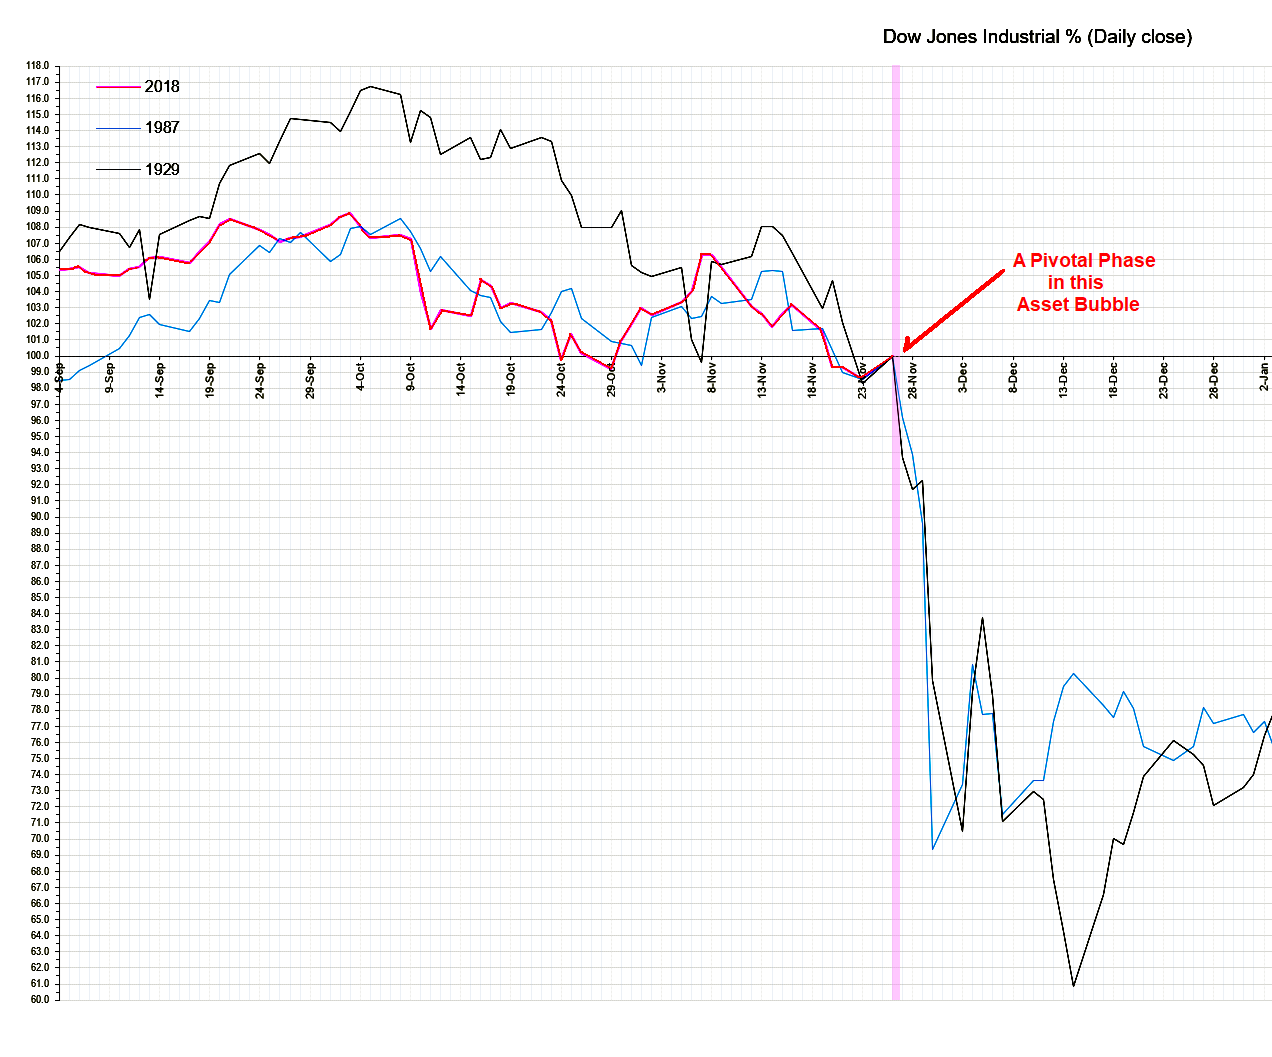
My friend who has been creating this chart below seems rather exercised by the correlation. He has lots of charts showing the math behind it, and so forth.
What it says to me is that we are at a financial asset bubble top, which appears to have crested.
The old short seller in me knows that the resolution of this depends on what happens next.
While the ‘signature’ looks rather good, it must be confirmed by a market break, and then a failure of the powers of the financial system to rescue it.
I have been here many times before in the past forty years of trading.
A bull market makes everyone feel like a genius; a bear market crash brings them back down to their knees. Most investors and traders would do well to preserve what they have.
I have taken precautions for myself. You may wish to do the same.
But I am not yet actively shorting the market. This may say more about my current conservative stance towards trading.
In the early 2000’s I would have been playing this to the downside, aggressively in-size and short term, in the futures markets.
But that is a younger man’s game.
At some point we may see the safe havens come back into vogue. But it appears that is not yet the case.
In a general panic everything gets sold in a liquidation for the short term.
The only difference is the distribution of pain, and the speed at which some assets may rebound.
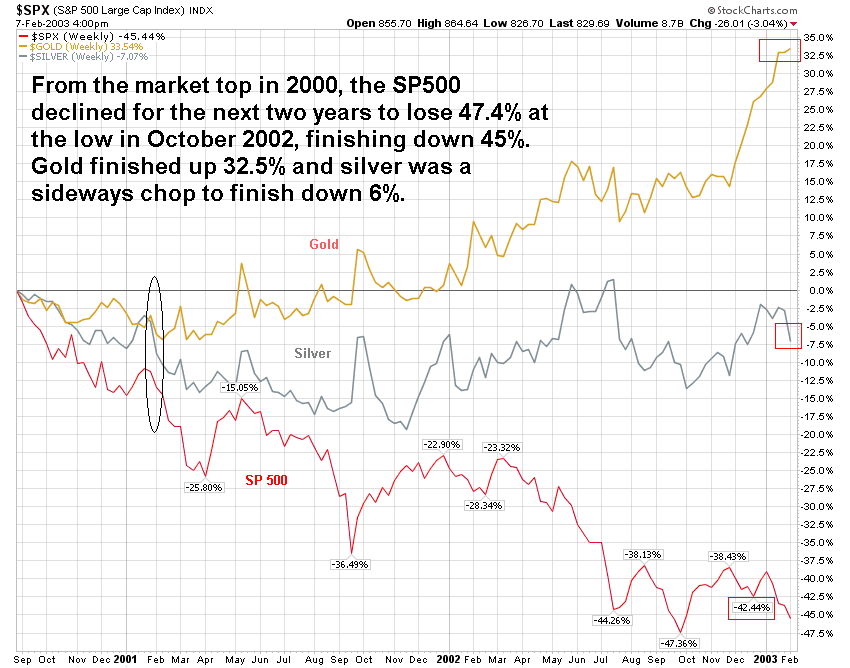
I include a relevant example from the 2001 crash below.


