
 To all our readers, near and far (we have many readers in other countries), Thank You for making us part of your weekly market review during 2023.Hopefully, reading this Outlook and our other articles have helped you navigate the volatile markets this past year.More importantly, if you are one of our many readers that utilize the our strategies to help you manage your investment portfolio more effectively and efficiently, most of our strategies had a very good year. These strategies also had a solid year of gains during the down market in 2022. For a look back over the past two years, we offer the following table of returns (your results may be different depending on when you took the signals. All MarketGauge.com signals were predicated on market on open orders, and targets and stops were taken when the signal was generated)
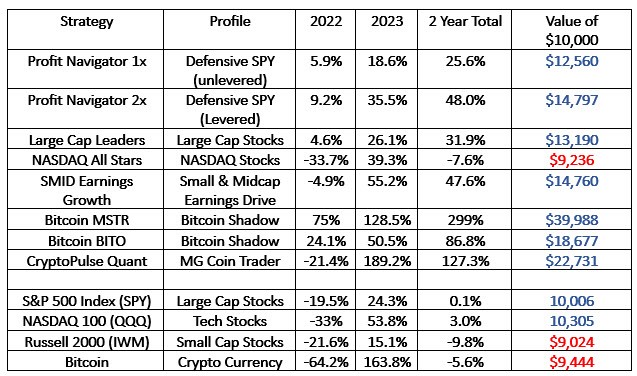
Of course, these numbers do not include trading fees, commissions, or asset management fees that a money manager might charge.
A look back at 2023Heading into 2023 from the dismal markets of 2022, the average forecast from the “street” was for the S&P to close around 4,000. Friday, the S&P 500 closed at 4,760 and less than 2% from a new all-time high. In other words, we closed 19% above the average Wall Street’s average year-end target.It is important to point out that just 2 months ago, the S&P 500 was trading at 4100 and in-line with the average year-end forecasted target. Institutional investors were bearish and defensive towards the end of October.In early November, Jerome Powell and the Federal Reserve went beyond halting rate increases and made an “about face.” Due to this Fed Pivot of a possible 3 interest rate cuts in 2024, institutional investors put much of their cash sitting on the sidelines to work quickly.Tracking the inflows, it was apparent to get this money invested quickly, many institutional investors (and retail) just bought the very large and liquid major indexes. November and December, experienced record new money in flows, especially into the cap weighted S&P 500 index.Because of the “Fed Pivot”, the markets went well beyond the average forecasts and rocketed higher. Here is the 2-month performance of the four main indices.

Here is what the S&P 500 looked like for the last two months (60 days) as the market surpassed the average Wall Street forecast. See graph below:
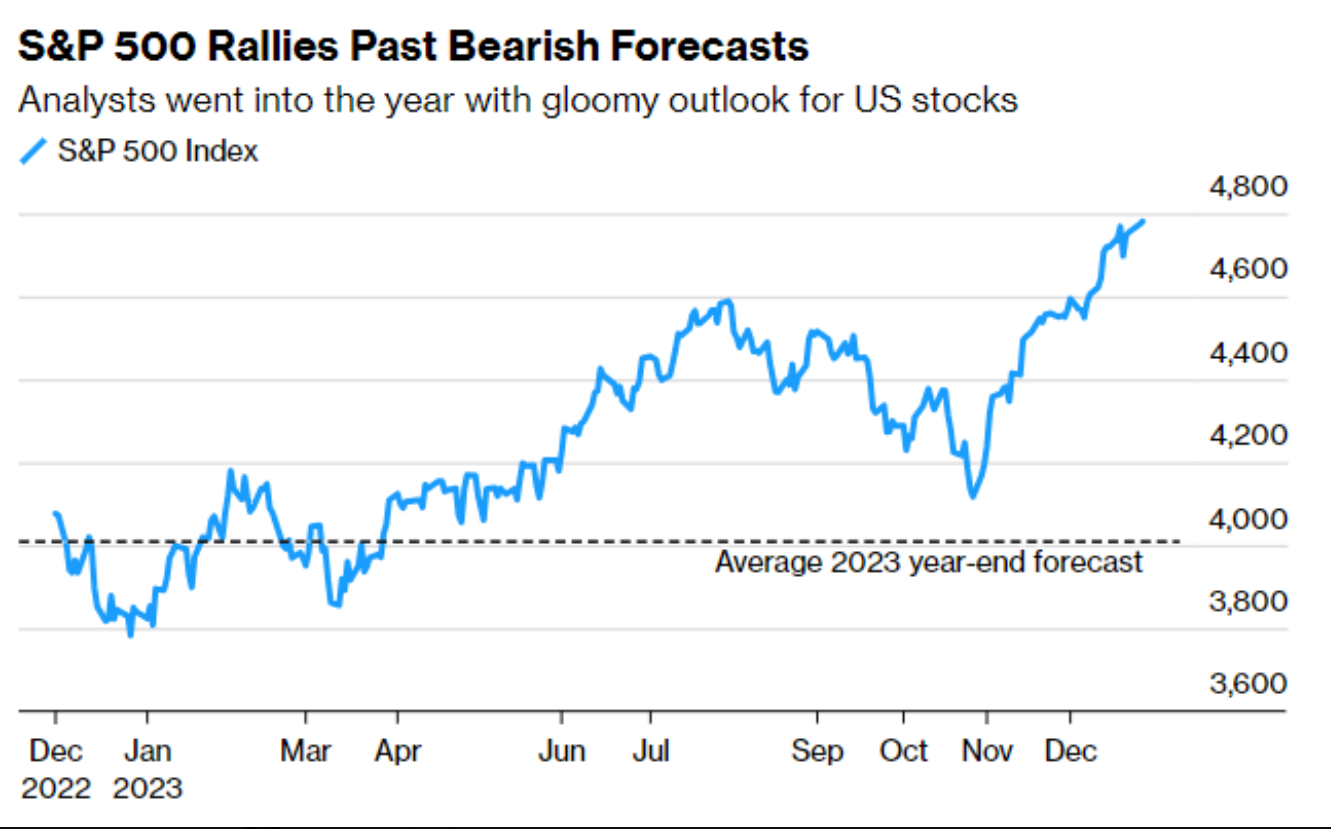
Because of the steep and almost parabolic move higher, most analysts now believe that the stock market is pricing in not 3 rate cuts in 2024 but more like 6-7. We agree with them that the market has gotten well ahead of itself.The only way that we see more than 2 or 3 Fed rate cuts is if the economy slows much more than expected and we go into a mild recession, or some exogenous event (War) occurs.That is not in our crystal ball and certainly Mish shares in this being a way too optimistic and rosy interest rate scenario. If anything, we believe that just like the 1970’s, it is possible that inflation picks up in the next few months and stalls an early 2024 interest rate cut in March as many pundits are now expecting.We also like to review where institutional money (large funds) are invested. We do this by looking at the Russell 1000 indices which are made up of the main Russell 1000 index (RUI) and then the Russell 1000 Value (RLV) and Russell 1000 Growth (Growth):

Large-cap growth stocks were the place to be (similar to our Large Cap Leaders and NASDAQ All Stars) for the 4th quarter and all of 2023. Value was out of favor but started to come back in vogue during the 4th quarter when it made up all of its returns for the whole year.With the outperformance by Growth in 2023 and the good year Value had in 2022, they are now back to where they began two years ago. They are mirror images of each other. See chart below:
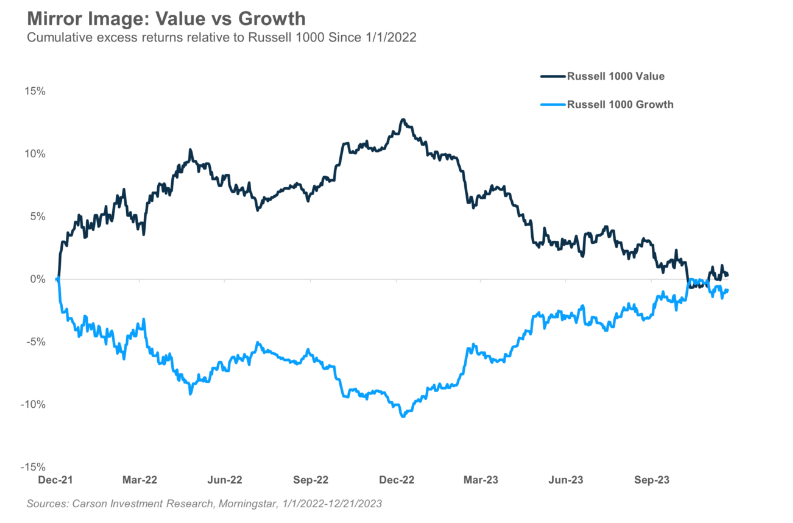
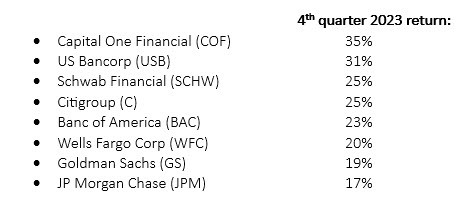
Value stocks, made up of Financials, Consumer Staples, Real Estate and Energy were not desirable investment themes during 2023 until the Fed Pivot. Once interest rates began declining in anticipation of the projected proposed Fed rate cuts in 2024, these areas began to rally.Among the best 4th quarter investments were the following large-cap financial stocks:
Some believe 2023 played out exactly as expected.If you have been a longtime reader of these Market Outlooks, you will undoubtedly know that we are big fans of Ryan Detrick of The Carson Group. I began following Ryan when he was in a similar role with the large RIA firm LPL.According to Ryan, 2023 played out exactly as it was expected according to his Pre-Election year historical perspective. These years are usually strong, but they are even better under a first-term President and up more than 20% on average.Breaking the four-year presidential cycle down by quarters, stocks tend to do quite well the first of a pre-election year (like 2023), catch their breath in Q3, then gain into year end. Below is the chart that Ryan shared with his readers many times during 2023. He (and us) is amazed how well it actually played out.
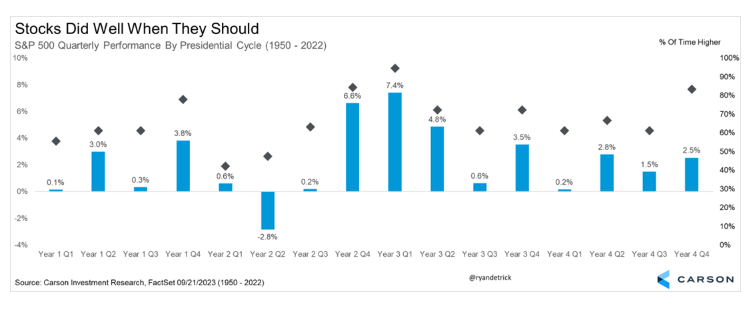
What’s in store for 2024?You may recall some of my predictions for the upcoming year from last week’s Market Outlook. If you did not have a chance to read it or you would like to review it again (along with the predictions) please go here.Additionally, if you have looked closely at the last chart above containing the 4-year Presidential Cycle by quarters, you will notice a much more subdued year is expected, if history and this cycle is any indication.
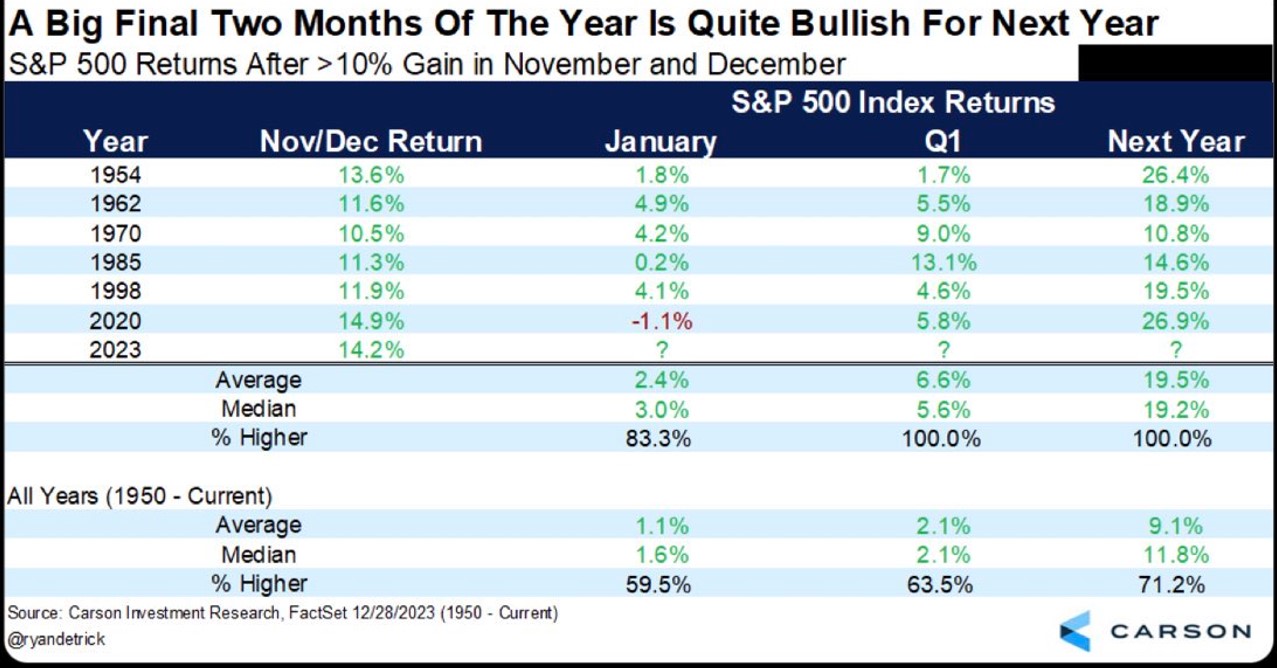
The January effect.According to our friend Jeff Hirsch’s important service, Stock Trader’s Almanac 2024, the January Barometer predicts the year’s course with a .726 batting average. That equates to a 72.6% chance that January’s performance will set the course for the rest of 2024’s stock market performance.The Stock Trader’s Almanac also points out that there is an 83% chance that we will see a positive year return for the S&P 500 if the first five trading days are positive. So watch closely for next week’s Market Outlook as we track the first 4 days and provide a perspective on the chance that the first five may be positive.Regardless of what happens in the first five trading days or the month of January, or what our opinion on the markets might be, our investment models and All-Weather Portfolio Blends will keep doing what they are supposed to do.The last two months can be an important predictor of the next year’s returns.Another chart published by Ryan Detrick at the Carson Group also shows the higher likelihood of a good return if the last two months are positive. See chart below:
Earnings growthAs you can glean from our newest MarketGauge investment strategies (SMID Earnings Growth) and much of our writing, the stock market typically follows earnings. Provided that the two other important variables, interest rates, and inflation, are under control, the stock market will follow earnings.Earnings are still growing and are expected to continue growing in 2024. While the rate of growth for mega caps stocks has come way down, the market on a whole is still seeing average earnings growth of 7-9% going forward into 2024. We suspect that you really won’t see a bear market in stocks until earnings begin to flatten or even decline.Many of the small and mid-cap companies are growing their earnings at double digit rates. This is why many analysts, including us, believe that the small and mid-cap area of the market has the best chance for higher gains than many of the large mega cap stocks.The Magnificent 7 stocks which now make up more than 30% of the S&P 500’s weighting (AAPL, AMZN, GOOGL, MSFT, NFLX NVDA, TSLA) are now selling for over 51x a forward P/E. The S&P 500 is currently trading at 25x forward P/E. These 7 stocks are trading for more than 2x the S&P 500 index. See chart of the Magnificent 7 stock performance this past year:
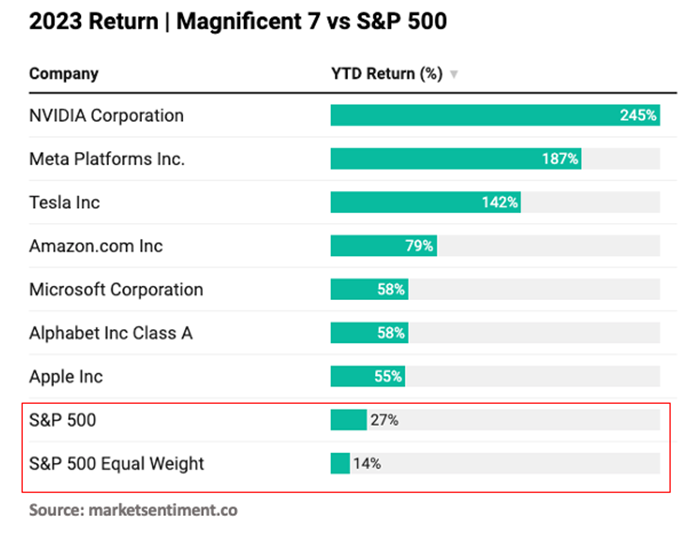
The equal weight S&P 500, (RSP) is currently trading at 17.5% times forward P/E. The equal weighted index, to us, may provide a better opportunity in 2024 and give investors exposure to Value stocks. Many of the stocks that did not participate fully this past year are terrific candidates for stock price improvement in 2024. Stocks are positive in an election year.To provide one more additional perspective on what might occur in 2024, we provide the following chart, also from Ryan Detrick. 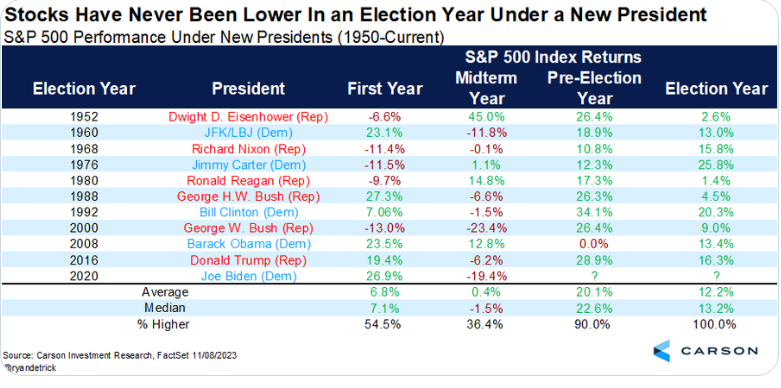
In upcoming Market Outlooks, we will provide a comparison of what some other analysts on Wall Street expect. For now, we hope you get the idea that 2024 may be another good year, but we do not expect outsized gains given the high multiples in some of the larger mega-cap stocks.We hope that these future forecasts are correct. We will close by stating the obvious:“We encourage you to rely on our rules-based, formulaic quant models. These strategies were designed to be opportunistic and risk averse. Almost all of our investment models, over a longer term market cycle have historically declined 50% or less than the index that they are compared to.”We wish you and your families an enjoyable New Year. May it be filled with good health, joyful family get togethers and a productive and prosperous 2024! Have a good holiday weekend and a great January 2024.More By This Author:More From Mish’s Outlook 2024 – Gold and Silver
Stock(ing) Stuffers That Could Be Lovin The High 2024
Has The Fed Engineered A Soft Landing? A Deep Dive On the Magnificent 7


