As part of a new series, each week we typically conduct a DCF on one of the companies in our screens. This week we thought we’d take a look at one of the stocks that is not currently in our screens, Amazon.com Inc (AMZN).
ProfileAmazon is a leading online retailer and one of the highest-grossing e-commerce aggregators, with $386 billion in net sales and approximately $578 billion in estimated physical/digital online gross merchandise volume in 2021. Retail-related revenue represents approximately 80% of the total, followed by Amazon Web Services’ cloud computing, storage, database, and other offerings (10%-15%), advertising services (5%), and other. International segments constitute 25%-30% of Amazon’s non-AWS sales, led by Germany, the United Kingdom, and Japan.
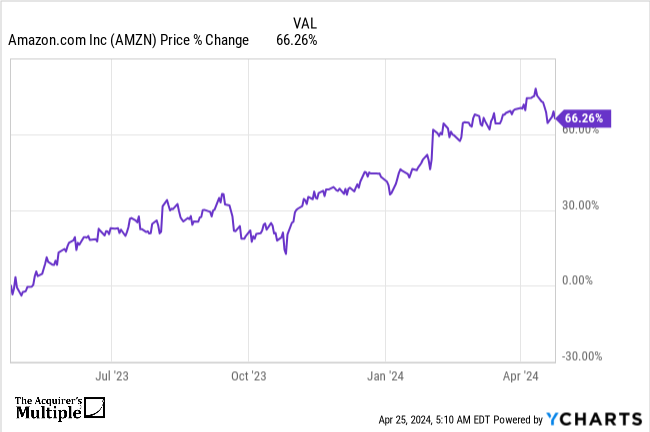
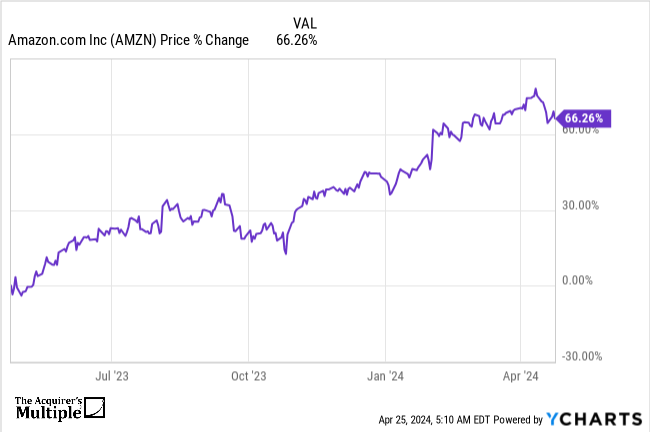
Recent PerformanceOver the past twelve months, the share price is up 66.26%. AMZN data by YChartsInputs
Forecasted Free Cash Flows (FCFs)
Terminal ValueTerminal Value = FCF * (1 + g) / (r – g) = 570.91 billionPresent Value of Terminal ValuePV of Terminal Value = Terminal Value / (1 + WACC)^5 = 371.05 billionPresent Value of Free Cash FlowsPresent Value of FCFs = ∑ (FCF / (1 + r)^n) = 105.79 billionEnterprise ValueEnterprise Value = Present Value of FCFs + Present Value of Terminal Value = 476.84 billionNet DebtNet Debt = Total Debt – Total Cash = -15.08 billionEquity ValueEquity Value = Enterprise Value – Net Debt = 491.92 billionPer-Share DCF ValuePer-Share DCF Value = Enterprise Value / Number of Shares Outstanding = $47.39
Conclusion
Based on the DCF valuation, the stock is overvalued. The DCF value of $47.39 per share is lower than the current market price of $176.59. The Margin of Safety is -272.62%.More By This Author: Apple Inc. DCF Valuation: Is The Stock Undervalued?Why Alphabet Inc (GOOGL) Stock Is A Buy? Microsoft Corp. DCF Valuation: Is The Stock Undervalued?


