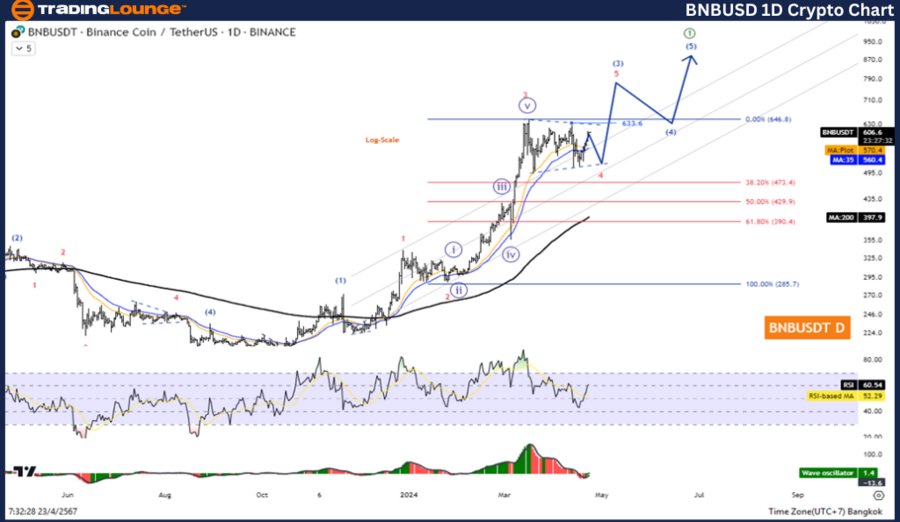
 Image Source: PexelsElliott Wave Analysis TradingLounge Daily Chart, Binance/ U.S. dollar(BNBUSD)BNBUSD Elliott Wave Technical AnalysisFunction: Counter TrendMode: CorrectiveStructure: TrianglePosition: Wave ((D))Direction Next higher Degrees: wave 4Wave Cancel invalid level: 508Details: Correction in Triangle pattern before rising again in Wave 5.Binance/ U.S. dollar(BNBUSD)Trading Strategy:The short-term correction in Wave 4 with the Triangle pattern continues because there is still another decrease in Wave E before an increase in wave 5. So wait for the correction to complete to look for opportunities to join the trend again.Binance/ U.S. dollar(BNBUSD)Technical Indicators: The price is above the MA200 indicating an Uptrend, and The Wave Oscillator has a Bullish Momentum.
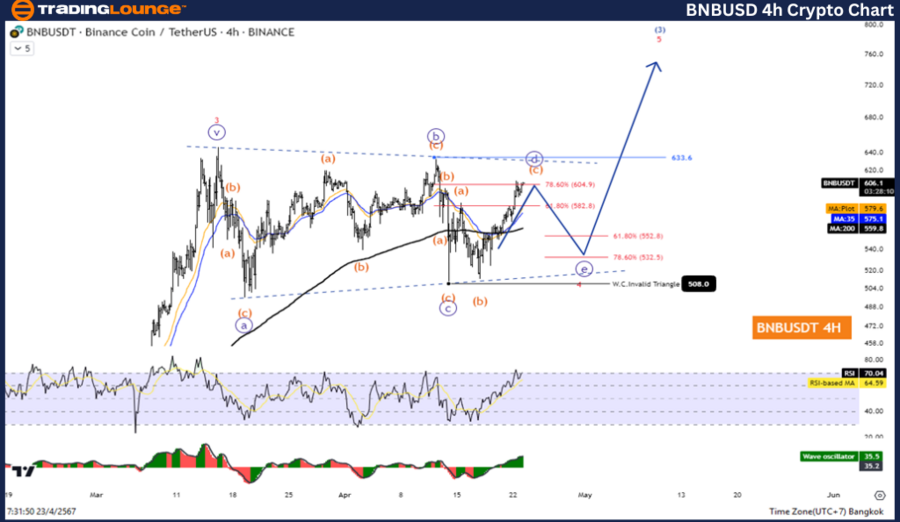
Elliott Wave Analysis TradingLounge H4 Chart,Binance/ U.S. dollar(BNBUSD)BNBUSD Elliott Wave Technical AnalysisFunction: Counter TrendMode: CorrectiveStructure: TrianglePosition: Wave ((D))Direction Next higher Degrees: wave 4Wave Cancel invalid level: 508Details: Correction in Triangle pattern before rising again in Wave 5.Binance/ U.S. dollar(BNBUSD)Trading Strategy:The short-term correction in Wave 4 with the Triangle pattern continues because there is still another decrease in wave E before an increase in Wave 5. So wait for the correction to complete to look for opportunities to join the trend again.Binance/ U.S. dollar(BNBUSD)Technical Indicators: The price is above the MA200 indicating an uptrend, The Wave Oscillator is a Bullish Momentum.Technical Analyst: Kittiampon SomboonsodSource: Tradinglounge.com  More By This Author:Elliott Wave Technical Analysis: Visa Inc. – Monday, April 22
Elliott Wave Analysis: Natural Gas
Elliott Wave Technical Forecast: Unlocking ASX Trading Success: Transurban Group


