
Analyzing the Early Q3 Earnings Reports
The Q3 earnings season will really get going with the big banks coming out with their results. However, the reporting cycle has already gotten underway, with Pepsi (PEP – Free Report) becoming the latest S&P 500 member to come out with quarterly results. Pepsi’s report on October 8th was for the company’s September quarter. The other 21 S&P 500 members that have reported already in recent days were for their fiscal quarters ending in August, which we count as part of the September quarter tally.Pepsi came out with a slight EPS beat but missed on the top line and also modestly cut guidance. As problematic as this mixed showing suggests, Pepsi’s Q3 results and guidance were actually better than what many in the market feared. In other words, the mixed showing from Pepsi isn’t the same as the problematic reports from FedEx (FDX – Free Report) and Nike (NKE – Free Report) a few days earlier in this cycle. Importantly, Pepsi reiterated the existing long-term earnings growth guidance.We provide a scorecard of the 22 S&P 500 members that have already reported Q3 in the body of the report. Looking at the results in terms of recent history, we see that the earnings and revenue growth pace for these 22 index members represents a decelerating trend, while the EPS and revenue beat percentages at this stage are tracking modestly below the historical averages for this same group of companies.
The Earnings Big Picture
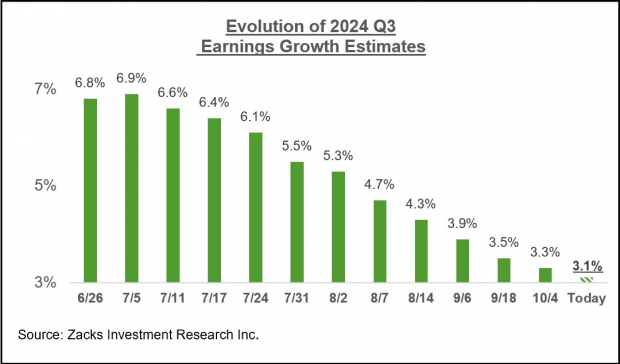
We noted earlier how the revisions trend has been notably negative ahead of the start of the Q3 earnings season. You can see this in the chart below, which shows the evolution of Q3 earnings growth expectations since the start of the period.
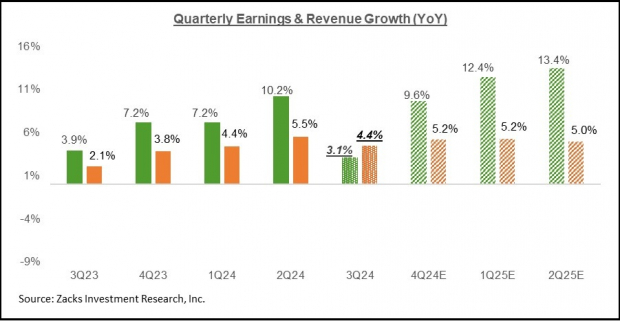
Image Source: Zacks Investment ResearchThis is a more significant decline to estimates relative to the comparable periods for the two preceding quarters. The negative revisions trend is widespread and not concentrated in one or two sectors, with estimates for 14 of the 16 Zacks sectors getting cut over this period. The Tech and Finance sectors are the only ones enjoying positive estimate revisions over this period.The negative revisions trend has been most pronounced for the Transportation and Energy sectors. We know that Energy sector estimates come under pressure when oil prices decline, with a softening oil price backdrop typically serving as a catalyst for positive estimate revision trends in the Transportation sector since fuel expenses are so costly. However, the weakening revisions trend for the Transportation sector shows that operators in the space are faced with softening demand trends as well.The quarterly earnings growth pace is expected to improve from next quarter onwards. You can see this in the chart below that shows the overall earnings picture on a quarterly basis.
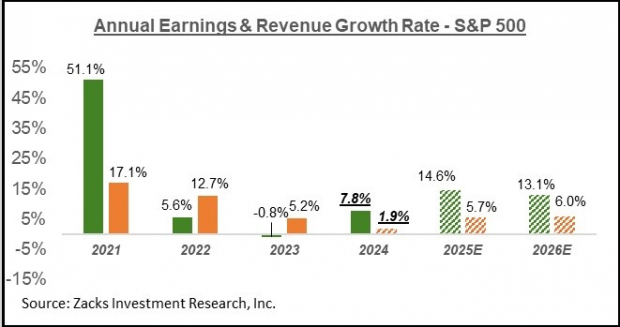
Image Source: Zacks Investment ResearchThe chart below shows the overall earnings picture on an annual basis. Image Source: Zacks Investment ResearchPlease note that this year’s +7.8% earnings growth on only +1.9% top-line gains reflects revenue weakness in the Finance sector. Excluding the Finance sector, the earnings growth pace changes to +7.3%, and the revenue growth rate improves to +4.3%. In other words, about half of this year’s earnings growth comes from revenue growth, with margin gains accounting for the rest.More By This Author:Are Bank Stocks A Buy Ahead Of Quarterly Results? Earnings Growth Set To Accelerate Previewing The Q3 Earnings Season – Saturday, Sept. 28


