
The banks and other Finance sector companies gave us a good start to the Q3 earnings season. However, we will see if this favorable trend will continue this week as the Q3 reporting cycle really ramps up, with more than 450 companies reporting results, including 109 S&P 500 members. By the end of this week, we will have seen Q3 results from 36% of S&P 500 members, representing all key sectors of the market.Through Friday, October 18th, we have seen Q3 results from 71 S&P 500 members that collectively account for 15.6% of the index’s total market capitalization. Total earnings for these companies are up +6.3% from the same period last year on +4.8% higher revenues, with 81.7% of the companies beating EPS estimates and 67.6% beating revenue estimates.The proportion of these 71 index members beating both EPS and revenue estimates is 60.6%.This is a better performance than we have seen from this group of 71 index members in other recent periods, as the comparison charts below show. The first set of comparison charts shows the earnings and revenue growth rates. Image Source: Zacks Investment ResearchThe second set of comparison charts compares the Q3 EPS and revenue beats percentages in a historical context.
 Image Source: Zacks Investment ResearchThe comparison charts below spotlight the revenue performance and the blended beats percentage for this group of 71 index members.
 Image Source: Zacks Investment Research
The Earnings Big Picture
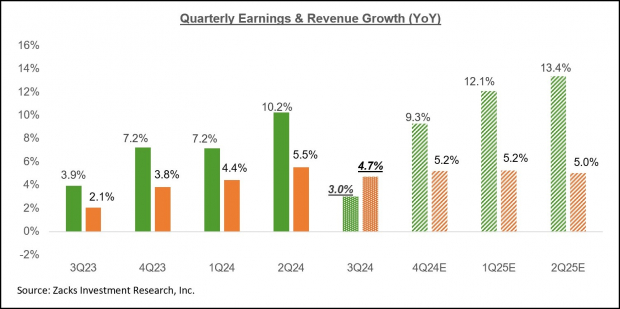
As noted earlier, we have more than 450 companies reporting results this week, including 109 S&P 500 members. The notable companies reporting this week include General Motors and 3M on Tuesday, Coca-Cola (KO – Free Report) and Boeing on Wednesday morning, Tesla (TSLA – Free Report) , IBM, and Lam Research after the market’s close that day, UPS (UPS – Free Report) and Southwest Airlines in the morning session on Thursday, and Colgate-Palmolive on Friday.Looking at Q3 as a whole, combining the results that have come out with estimates for the still-to-come companies, total earnings for the S&P 500 index are expected to be up +3% from the same period last year on +4.7% higher revenues.The chart below shows the Q3 earnings and revenue growth pace in the context of where growth has been in the preceding four quarters and what is expected in the coming three quarters. Image Source: Zacks Investment Research
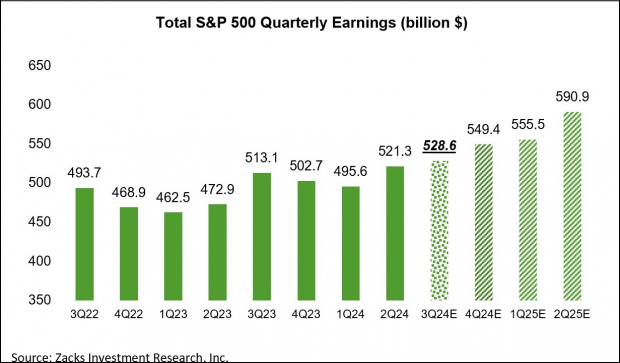
Notwithstanding the modest growth pace in Q3, the aggregate earnings total for the period is expected to be a new all-time quarterly record, as the chart below shows. Image Source: Zacks Investment Research
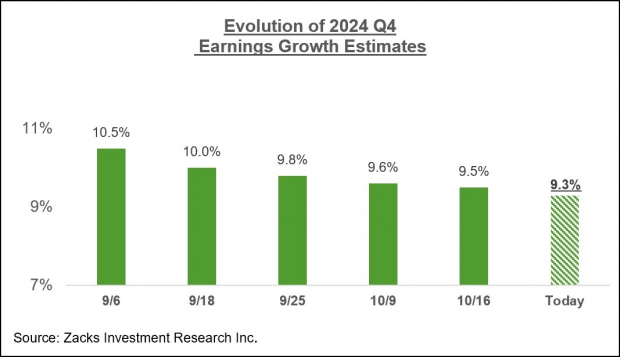
For the last quarter of the year, total S&P 500 earnings are expected to be up +9.3% from the same period last year on +5.2% higher revenues.Unlike the unusually high magnitude of estimate cuts that we had seen ahead of the start of the Q3 earnings season, estimates for Q4 are holding up a lot better, as the chart below shows. Image Source: Zacks Investment Research
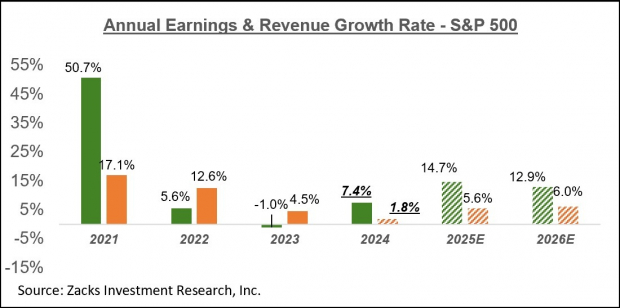
The chart below shows the overall earnings picture on a calendar-year basis, with the +7.4% earnings growth this year followed by double-digit gains in 2025 and 2026. Image Source: Zacks Investment ResearchPlease note that this year’s +7.3% earnings growth improves to +9.3% on an ex-Energy basis.More By This Author:The Q3 Earnings Season Kicks Off PositivelyA Detailed Analysis Of Q3 Earnings ExpectationsAre Bank Stocks A Buy Ahead Of Quarterly Results?


